Total Quality Management System (TQMS) – QMS at the Next Level
What Is TQMS?
A Total Quality Management System (TQMS) is a way to manage manufacturing so that quality is built into every step, not inspected at the end.
Instead of asking, “Who made this error?”; TQMS asks:
- Why did you make this error?
- How can you keep this from happening again in the future?
The TQMS approach includes three key elements:
- Quality at every step: A proactive method of detecting defects before they occur.
- Employee engagement: Employee training to identify and address issues.
- Continuous Improvement: Use of actual data to assist in making quality-related decisions.
TQMS does have the word “system” in it, but it’s not just about software alone. It is a company-wide mindset, supported by simple tools and clear processes.One of the most effective ways to learn about a TQMS is to apply the system to a sample manufacturing plant. Below is a detailed, illustrative case study of how TQMS was implemented at Sunnyvale Electronics, a fictional mid-size electronics manufacturer. This case study illustrates the practical operation of the TQMS system in a manufacturing environment. The case study contains actual metrics, timelines, and results.
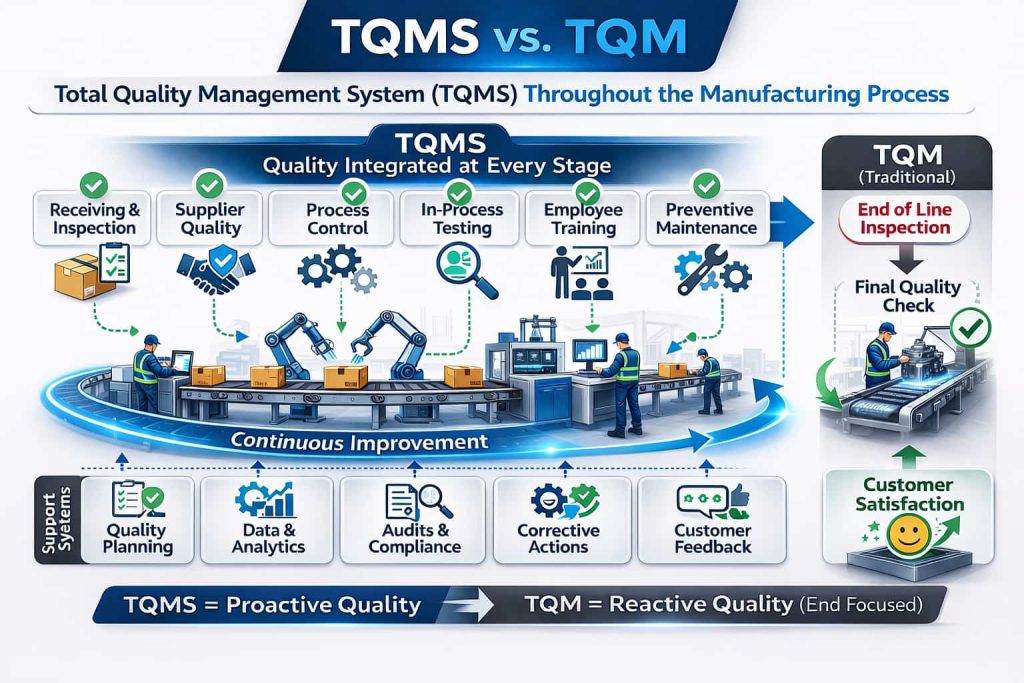
TQMS vs. Total Quality Management (TQM)
Traditional quality control, Total Quality Management, focuses on inspection after production. TQMS builds quality into the production process itself. The overall purpose of TQMS is to provide a framework for creating processes that can be both controlled and stable and therefore less reliant on reactive inspection. Another name for the framework or processes that make TQMS unique is system and it is the “system” that distinguishes TQMS from TQM both in name and practice.
TQM vs TQMS
| Quality Aspect | Total Quality Management (TQM) | Total Quality Management System (TQMS) |
| When Quality is Checked | Quality checked at end of production line | Process performance monitored and controlled at every production stage |
| Defect Detection Timing | Defects detected after all labor and materials invested | Problems caught immediately at point of occurrence |
| Root Cause Analysis | Root cause investigation is time-consuming and retrospective | Root cause is obvious from checkpoint data |
| Quality Ownership | Quality responsibility assigned to dedicated inspectors | Quality responsibility shared by all production workers |
| Problem-Solving Philosophy | Reactive problem-solving after defects occur | Proactive problem prevention through early detection |
Sunnyvale Electronics – TQMS Case Study
Sunnyvale Electronics was a small but rapidly growing consumer electronics manufacturer. Their products ranged from Bluetooth speakers to smart home sensors. As product demand rose, so did the number of manufacturing-related problems.
Prior to applying TQMS, the production floor at Sunnyvale looked like complete chaos.
- Missing Production Targets – They had a daily production target of 500 units, but could only produce about 420 units.
- High Defect Rate – 7% of products needed rework
- Customer Complaints – 15–20 per week
There were no standard quality procedures used by the company. Components received for production were delivered to the assembly line without being tested. Workers assembling the products had no checkpoints to verify product quality prior to passing the units to the next workstation. Once a defect was identified at final inspection, determining the source of the problem required time-consuming and laborious disassembly and investigation of the unit.
Quality control was limited to the end of the production cycle. At that point, materials had been expended, labor hours had been worked, and the defect had often be compounded across multiple production steps.
Implementing TQMS at Sunnyvale
Phase 1 – Quality Control for Receipt of Materials
The company established a quality control process at the receiving dock. All shipments of materials, including electronic components such as circuit boards, Bluetooth chips, sensors, batteries, and enclosures, were tested before being placed into inventory.
Testing protocols were setup for the following components:
- Electronic Components – 10% of sample size tested for functionality
- Circuit Boards – visual inspection and continuity testing
- Mechanical Components – verification of dimensions and fit testing
- Batteries – Voltage and capacity testing on 5% of the sample
Here are the results of the weekly testing:
| Issue | Frequency | Impact on Output |
| Faulty Bluetooth chips | 20 units/day | Delayed 2 hours/day |
| Improper assembly | 15 units/day | Rework required |
| Packing errors | 10 units/day | 5 units lost/day |
All components that did not meet specifications were rejected and no defective components entered the production process.
Phase 2 – Quality Control Checkpoints
The production line was divided into designated zones (quality control checkpoints) where specific quality inspections took place:
Checkpoint 1 – Component Placement Station
Here, employees examined whether all the components were properly placed on the printed circuit board in the correct orientation and whether they were properly seated. Employees were particularly careful about verifying capacitor and diode polarity, as improper polarity could result in an immediate failure. An employee examined every product that went through this station.
Checkpoint 2 – Soldering Station
Employees who operated the soldering station used magnification to examine the quality of the solder joints and ensure that the solder flowed properly and formed good electrical connections. Employees at this station were looking for cold solder joints, solder bridges between adjacent connections, and insufficient solder that resulted in poor electrical connections. Every product received this examination before proceeding to the next station.
Checkpoint 3 – Firmware Station
At the firmware station, employees tested whether the firmware had successfully loaded onto the unit, and if so, they performed a functional test to determine whether the unit functioned properly after powering up, whether the unit could be paired with a Bluetooth device, and how the unit responded to user input. Employees also determined which version of software was loaded. All products received this type of testing before being packaged for sale.
There were written standards for what constituted a “pass” or “fail” for each station. In addition, employees documented their findings digitally at each station.
Phase 3 – Collecting and Displaying Data
A real-time tracking system was developed to provide management with a real-time view of quality performance at all levels of production. The system tracked:
- The number of passes or fails at each checkpoint
- The number and type of defects identified at each checkpoint
- The rate of production by shift and station
- Times of all quality-related events
- A correlation between defect types and other factors (operator, component lot, time of day, etc.)
Management could monitor production data in real-time via a dashboard system. When production metrics deviated from expected values, the system automatically sent alert messages to management.
TQMS Problem Detection and Resolution
The TQMS revealed problems that were previously undetectable under the old system.
Case 1: Bluetooth Chip Quality Issue
During the first week of receiving shipments and conducting initial testing, 30% of the Bluetooth chip lot from a certain supplier batch failed connectivity testing. There were 200 Bluetooth chips in the batch, and each chip cost $9.
Challenge: The chips would have been incorporated into printed circuit boards, soldered into them (adding $14 in parts to each unit), processed through three assembly stations (approximately $8 per hour for labor), and then would have failed the final testing. The total loss of resources would have been 60 units x $31 = $1,860, plus around 12 hours of lost labor.
Solution: The defective chips were removed from processing at receiving. The supplier shipped a replacement lot overnight ($140 shipping cost). The rest of the production used up existing stock.
Impact: The total cost was reduced to $140, and no time was lost.
Case 2: Soldering Temperature Calibration Shift
After two weeks of collecting checkpoint data, the TQMS revealed a trend: soldering defects occurred at a 2.1% rate during the morning shift, but 6.8% during the afternoon shift.
Challenge: An investigation found that the temperature of the soldering irons had changed over the course of the day. They began the day at the proper calibration level but had cooled off by 15°C by the afternoon. As a result, the reliability of the solder joints was compromised.
Solution: A mandatory recalibration of the soldering iron temperature was required at the start of each shift. Within three days, soldering defects decreased from an average of 4.5% to 1.6%.
Impact: This one solution reduced the approximate number of defective units produced per day from 15 to 0. It saved the company approximately $465 per day in rework costs, which is equivalent to $120,000 per year.
Case 3: Firmware Upload Network Congestion
Challenge: Dashboard data showed that the percentage of firmware upload failures was 1.1% on Monday-Wednesday, but increased to 4.2% on Thursday and Friday.
It was discovered that the company’s Internet connection speed was slower on Thursday and Friday because there was more activity in the surrounding industrial area. At the end of the week, firmware downloads from the cloud servers timed-out more often.
Solution: The company hosted its own firmware update server locally rather than downloading it from the cloud for each unit. The percentage of failures decreased from 2.7% to 0.3%.
Impact: This eliminated approximately 11 defects per day, which is equivalent to saving the company approximately $220 per day in rework costs. That is approximately $57,000 per year.
TQMS Results: 30-Day Performance Comparison
In the 30 days since it has been fully operational, the TQMS has demonstrated significant improvements in Sunnyvale’s metrics:
| Metric | Before TQMS | After TQMS | Improvement |
| Production | |||
| Daily output | 420-450 units | 495-500 units | 14% |
| Defect rate | 7.00% | 1.50% | -79% |
| On-time delivery | 73% | 96% | +23 points |
| Quality | |||
| Customer complaints/week | 15-20 | 4-Jan | -78% |
| Retail return rate | 4.30% | 0.80% | -81% |
| Units requiring rework/day | 35 | 7 | -80% |
| Financial | |||
| Overtime costs | $4,200/week | $800/week | $176,800/year saved |
| Rework materials | $2,800/week | $600/week | $114,400/year saved |
| Total annual benefit | $627,200 |
The added production capability (50 more units per day) resulted in an annual increase in profit, with no addition of labor or capital expenditures.
6 TQMS Strategies that Make It Work
Sunnyvale demonstrates all of the key components of a successful TQMS:
- Incoming Quality Control: The purpose of validating material quality before production has begun, using a combination of supplier controls, performance monitoring and risk-based validation, is not to enhance inspection activities, but to provide assurance that defects will be eliminated at the point where they occur by having assurance that all upstream processes have been performed correctly.
- Process Checkpoints: The steps of each production are operated in predetermined limits, and all validated settings and documented standards are applied at each operation. Instead of depending solely upon inspections, the ultimate objective is to assure that the process will produce a product that meets specifications in every instance.
- Real-Time Data Collection: As each quality issue develops, information about each quality issue is collected in a database, providing visibility into patterns that may not have been apparent using only human observations. Many issues appear to be random but patterns emerge once sufficient data has been collected.
- Clear Quality Standards: Remove ambiguity as to what constitutes quality; workers can then determine whether their work meets established quality standards by self-verifying their own work.
- Closed-Loop Corrective Action: Once a quality issue develops, the TQMS identifies the issue and stimulates the investigation and corrective action processes. The corrective actions are confirmed via improvements to the metric values.
- Continuous Monitoring: Quality does not improve through a single effort. The quality monitoring continues to look for signs of decline or new quality issues and corrects them prior to them becoming major issues. Employees are dedicated to the continuous optimization of processes.
Key Performance Indicators for TQMS
To measure the effectiveness of TQMS, organizations need to have an established set of KPIs:
TQMS Quality KPIs:
- First-Pass Yield (FPY): The ratio of parts or products that are accepted as meeting specifications to those that require rework, repair, or inspection.
- Defects Per Million Units Produced (DPMU): The number of defects divided by the total number of units manufactured.
- Defect Detection Rate (DDR): A metric measuring the proportion of defects discovered through quality inspections compared to the overall number of defects present.
- Customer Complaint Ratio: The ratio of customer complaints about defective products to the number of products purchased.
- Return Rate: The ratio of returned products due to defective or non-conforming conditions.
- Warranty Claim Ratio: The ratio of products where customers filed warranty claims to the number of products sold.
TQMS Efficiency KPIs:
- Overall Equipment Effectiveness (OEE): Measures the productivity of a plant or department based on the availability of equipment, its performance level, and quality output.
- Throughput: The volume of items processed over a given time frame (e.g., hour, shift, day).
- Cycle Time: The total time it takes to produce a single item from start to completion.
- Rework Rate: The percentage of items needing rework or correction after their first processing cycle.
- Scrap Rate: The percentage of items rejected because they do not meet standards and therefore must be discarded.
TQMS Cost KPIs:
- Cost of Quality: The sum of three types of costs: prevention costs, appraisal costs, and failure costs.
- Rework Costs: Labor and material costs incurred during the rework of defective items.
- Scrap Costs: Materials and labor costs lost when defective or non-conforming items are scrapped.
- Warranty Costs: Costs for repairs or replacement of defective or failed products.
- Inspection Costs: Labor and equipment costs involved in conducting quality tests and verifications.
Process KPIs:
- Process Capability Index (CPK): A statistical measurement of how well a process will consistently produce output within acceptable specifications; a higher CPK indicates better consistency.
- Mean Time Between Failures (MTBF): The average time that a piece of equipment or a process operates before it fails or breaks down.
- Mean Time To Repair (MTTR): The average amount of time needed to diagnose and correct a malfunction.
- Time to Resolve Defects: The length of time from the point a defect is detected to the time it is resolved.
The most important KPIs for Sunnyvale were defect rate, first-pass yield, and throughput. These three KPIs were also the most direct indicators of the company’s profit margins and customer satisfaction levels.
Conclusion
A Total Quality Management System (TQMS) is a powerful tool for manufacturers. When implemented properly, a TQMS provides a systematic approach to improving quality, efficiency, and employee engagement, while providing immediate feedback regarding production performance.