Sales & Operations Planning – Real 5 Stage S&OP Simulation
What is S&OP
Sales and Operations Planning (S&OP) is a supply chain process that:
- Predicts future products sales. (Forecast customer demand)
- Optimizes operations to produce and deliver products to customers (Purchasing, Manufacturing & logistics)
- Creates an efficient plan that reduces production costs and maximize profit.
The S&OP process creates the S&OP plan.
While S&OP focuses on mid- to long-term planning, S&OE (Sales & Operations Execution) focuses on short-term execution and operational response.
When Was S&OP Born?
The S&OP process was pioneered in the 1980s by companies like Procter & Gamble and IBM. The problem they faced was siloes between departments.
- Sales teams planned ambitious promotions to drive sales (demand). However, the sales team often did not consider whether the operations team could fulfill these many orders. Also, a few sales teams in the 1980s shared updated sales forecasts or live sales data with the operations teams.
- Operations teams didn’t have access to the sales forecast or live sales data, so they had no idea how many products to produce. As a result, they often produced too few or too many.
- Finance teams lacked insight into both sales and operations activities. As a result, they were unable to create an accurate budget for the organization.
Why is S&OP Important?
Here are some examples of the kinds of things that happened in the 80s and still happen today without S&OP alignment:
1. Excess inventory – Operations keep up production based on a 6-month-old sales forecast for a product that is not selling well. Extra unsold units pile up in warehouses, representing millions of dollars of unsold inventory. The warehousing costs for holding this inventory are quite expensive. Eventually, the company is forced to cut its losses by heavily discounting the product and eventually scrapping it altogether.
2. Stock-outs – The stockout is the reverse of the excess inventory problem. Say a sales department plans a massive advertising campaign for the upcoming month to promote a new product. The promotion is a big success, and the new product flies off the shelves. Unfortunately, sales never communicated their promotion or anticipated sales forecast to the operations team.
The operations team produced only enough units to satisfy a fraction of the demand. Not only is this a big loss of possible revenue, but consumers end up buying the products of a competitor, and market share is lost.
3. Missed revenue targets – Inventory, sales promotion, workforce, and operations activities all cost money, and in many cases are financed with debt. What happens financially when a debt is accumulated to produce a product that is expected to sell well, but it doesn’t? Part of this debt is used to cover manufacturing costs of the product, and part of it will be used for delivery of the product (quality inspection, shipping, and packaging labor hours). Unfortunately, the demand is much weaker than expected, and 75% of the inventory has been sold. That leaves quite a bit of debt allocated for delivery costs unused, and finance finds itself having to make interest payments.
More importantly, a smooth S&OP is important for accurately estimating and meeting company revenue targets. When the process malfunctions and results in missing revenue targets, investors are disappointed. Consistently missing revenue targets can undermine investor confidence and substantially decrease company valuation.
Questions the S&OP Process Answers
The S&OP process is run on a periodic basis, typically once a month to get answers to the following questions. It may be updated between cycles if assumptions have materially changed:
1. What products do we expect to sell in the future?
Forecasting takes historic sales data as a baseline and layers in planned promotional and sales activity to predict future consumer demand. Advanced AI and machine learning include causal factors to increase the accuracy of the Demand Plan.
2. What buffer inventory levels should we target at each echelon of the supply chain?
There is uncertainty in both the demand signal and the reliability of the supply chain. Inventory buffers are insurance against that uncertainty. If properly calculated that insurance which is achieved with inventory, can be purchased at the lowest possible cost.
3. What materials do we need to have in our warehouse to build these products?
We must make sure that we get the raw materials and subassembly components to our production facilities so that planned manufacturing activity can continue without interruption. We want to meet our inventory targets in our warehouse at the time they are needed because holding inventory has a cost.
4. How fast can we produce these products?
Our factories have a set number of machines and skilled workers that determine our production capacity and ultimately how fast we can produce the products that we sell. We will have to prioritize which products we make first.
5. Do we have the capacity to deliver these products to our customers on time?
The answer to this question requires answers to the above questions, because you can’t know when a product will be ready to ship until you know if you even have the necessary materials and the production capacity to build it. There may be alternative ways to supply the necessary capacity, and we need to decide on the optimal way to supply it.
6. How much profit do we expect to make this month?
When we subtract the estimated supply chain costs including purchasing, manufacturing and delivery costs from the estimated sales gross sales figures, we get the expected revenue for the month.
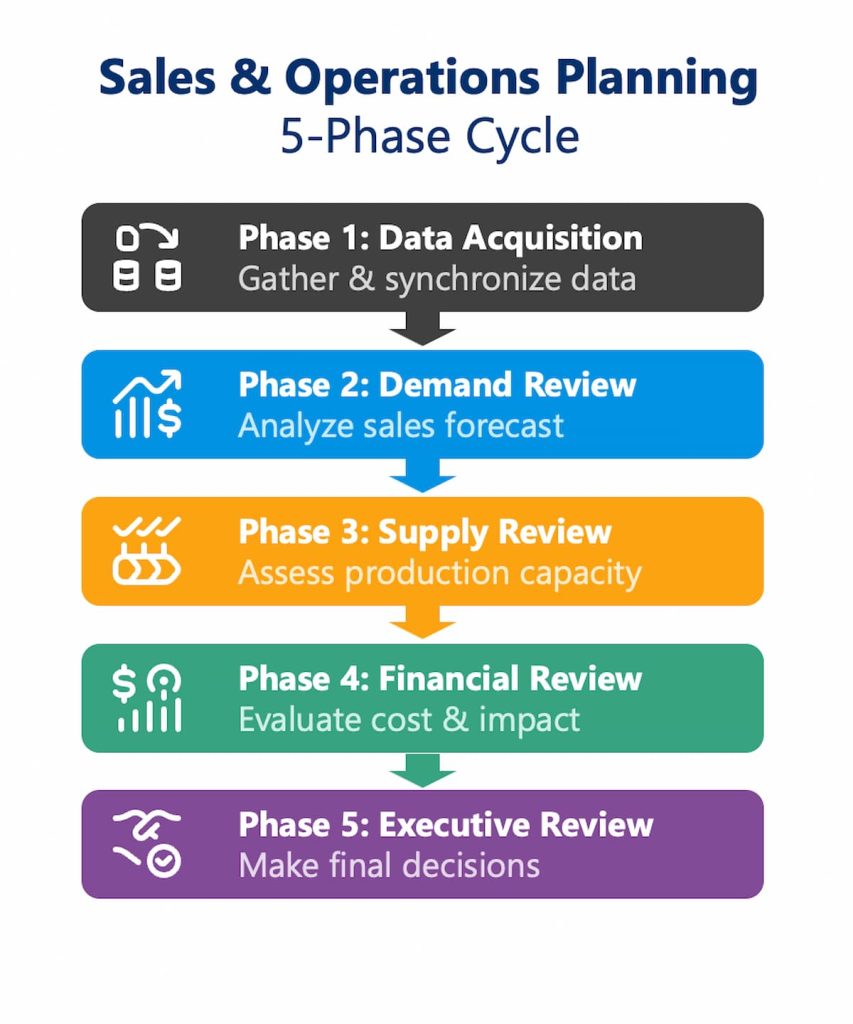
Full 5 Phase S&OP Process – TechEquip Simulation
To understand S&OP, you need to understand what happens at the S&OP meeting because this is where all the S&OP decisions are made. I am going to walk through each of the 5 S&OP meeting phases, discuss who is involved, what data is used, and how decisions are made.
To help you understand how the S&OP process works in practice, we will be following TechEquip Solutions, a fictional high-end electronic equipment manufacturer, through its monthly S&OP cycle. TechEquip produces three sophisticated testing equipment models ranging that cost roughly $500,000 per unit, with annual sales of approximately 300,000 units. We’ll see how they navigate the S&OP cycle at the end of July to create their August production plan.
TechEquip Solutions Production Overview:
– Product Portfolio – Alpha Pro, Beta Elite, Gamma Ultra
– Three assembly lines with different specializations
– Two test facilities for quality verification
Phase 1: Data Acquisition

Data is continuously being updated from the source systems so that the team has up to date information any time they need to do an update to the S&OP plan. The team members in different departments will use a synchronized copy of the data at a given point in time, so that they can all have the same structured data set to work with.
Let’s look at the systems and the data that are of interest to the S&OP participants at TechEquip.
Enterprise Resource Planning (ERP) Data
The finance team is interested in the revenue, cost, margins, and cash flow data in the financial module of the ERP system for the upcoming month (August) and for the next 12 months.
The Master Schedulers from the Supply Chain Operations team are interested in understanding inventory flows. They review the finished goods and work-in-process inventory (WIP) that represent the existing inventory on hand. They also look at open sales orders (SOs) to see what inventory they expect to ship out soon, and supplier commitments to know what inventory they expect to come in soon. Here is what this data looks like:
Current Inventory Position from ERP
| Product | Finished Goods | WIP | On Order | Allocated | Available |
| Alpha Pro | 38 | 25 | 65 | 35 | 3 |
| Beta Elite | 42 | 30 | 55 | 40 | 2 |
| Gamma Ultra | 15 | 18 | 25 | 20 | 0 |
Sales team members look at sales performance data in the form of customer orders in the ERP system. They look at how many products they sold vs. how many they had planned to sell in June. Here is what this data looks like:
June Sales Performance Data from ERP
| Product | Plan Units | Actual Units | Variance | Plan Achievement |
| Alpha Pro | 115 | 118 | 3 | 103% |
| Beta Elite | 125 | 120 | -5 | 96% |
| Gamma Ultra | 70 | 73 | 3 | 104% |
| Total | 310 | 311 | 1 | 100% |
Manufacturing Execution System (MES) Data
The Chief Operating Officer (COO) looks at key KPI’s generated from the MES data to identify inefficiency and quality problems. Important efficiency metrics are WIP by production stage, overall line throughput, and major downtime events. Important quality metrics include chronic equipment fail rates, yield rates, and scrap rates. Yield trends show how much material becomes usable product. Scrap percentages reveal waste patterns.
The master scheduler also looks at MES data, that are inputs to his plan. He examines WIP levels across operations, spotting trends in equipment usage and line efficiency. Performance gaps show up clearly when real throughput contrasts with daily plans. Machine uptime patterns emerge alongside recurring quality issues requiring repair loops.
Advanced Planning & Scheduling (APS) Data
The master scheduler uses the APS demand, materials, and capacity data to build the monthly production plan.
Here is what the capacity data from the APS system looks like:
Production Capacity Data from APS
| Resource | Nominal Capacity | June Utilization | Available Aug Capacity |
| Assembly Line A | 50 units/month | 98% | 48 units (maintenance) |
| Assembly Line B | 120 units/month | 92% | 120 units |
| Assembly Line C | 150 units/month | 94% | 150 units |
| Test Facility 1 | 170 units/month | 88% | 170 units |
| Test Facility 2 | 150 units/month | 95% | 150 units |
The master scheduler pressure tests this plan with what-if scenarios to make sure that it will maintain production despite demand spikes (unexpected influx of orders) and supply shocks (unforeseen shortages of materials or parts from suppliers).
Phase 2: Demand Review
The Director of Sales calls a demand review meeting with his sales management team, marketing executives, and demand planners.
Product Demand – The team reviews the sales numbers from May and June, the two previous months, to get a sense of the current demand for each product in the market.
Seasonality – The team looks at sales figures from July and August of the previous year to see the impact of seasonality on consumer demand. Sales notice that every August, they have a small boost in the number of Alpha Pro units. When they dig into the numbers, they realize that this is the time of year when several large repeat customers put in their yearly order. 5 Extra Alpha Pro purchase orders are expected in August.
Promotions – The head of sales works with the marketing managers to predict the additional demand that will be generated by planned promotional campaigns. The demand generation marketing team noted that their paid ads for the new Gamma Ultra feature show higher-than-average engagement. They expect these ads to drive approximately 15 additional units in August.
Market Trends – Sales and marketing leaders review the latest market intelligence to see how well aligned their product offerings are with the current consumer preferences. For example, utilizing competitor intelligence, the team discovers that a competitor is having quality issues. This presents an opportunity to gain 3-5% market share (about 20 extra units) with their Beta Elite product.
The team members apply these four predictive layers to determine the demand forecast … in other words, they come up with a prediction of what customers will buy in August, and over the course of the next few months. Here is what the demand plan for August looks like:
August Demand Plan
| Product | August | September | October | Q3 Total | Change from Preliminary |
| Alpha Pro | 115 | 135 | 130 | 380 | +5 units |
| Beta Elite | 145 | 150 | 145 | 440 | +20 units |
| Gamma Ultra | 90 | 95 | 100 | 285 | +15 units |
| Total | 350 | 380 | 375 | 1,105 | +40 units |
Phase 3: Supply Review
The VP of Operations calls together the supply team, consisting of manufacturing directors, the supply chain director, the planning manager, and the quality manager. The team reviews the demand plan that was just created in phase 2 to see if they can manufacture enough products, the supply, to meet this forecasted demand.
Preliminary Demand Plan
| Product | Demand | Base Capacity | Gap |
| Alpha Pro | 115 | 110 | -5 |
| Beta Elite | 145 | 130 | -15 |
| Gamma Ultra | 90 | 85 | -5 |
| Total | 350 | 325 | -25 |
Briefly, we can see that there is more demand than base product capacity. But how does the supply team calculate the base capacity? They look at the following 5 production constraints:
1. Production Capacity – The teams review equipment availability and production line capacity to see how many of the forecasted orders can be produced on time. A team member notices that Assembly Line A is scheduled for a 2-day preventative maintenance in August. Line A is the only line that has the specialized tooling needed to produce Gamma Ultra units. Line A had the capacity to produce the required 90 Gamma Ultra units when it was operating at full capacity, but that capacity will be decreased by the scheduled maintenance.
2. Labor Availability – The availability of staff and their certification/ability to run specific types of equipment is a critical constraint. If more labor capacity is needed, and this already appears to be the case with a requirement for 15 extra Beta Elite units, then it is commonly made available with overtime.
Overtime pay is at least 1.5 times that of regular pay, so additional labor capacity will come at a 150% cost premium.
3. Supplier Limits – The operations team has a contract with suppliers for the delivery of a specific number of parts per month. The estimates are created at the beginning of the year. Unfortunately, consumer demand fluctuates up and down, so often the manufacturers need a different number of parts each month. Delivering fewer parts is usually not a big issue, as they can be warehoused and delivered the following month. But delivering more parts than forecasted … especially parts that themselves consist of sub-assembly components with long lead times, or component parts that have a complex, time- consuming production cycle … that may require expediting an order with a supplier at a higher cost or many to be possible at all A specialized component, with a 1–2-week lead time, is required for each Alpha Pro model. It is therefore too late to increase the regular order from the supplier by 5 extra units for August. The manufacturer does have the option to place a rush order with this supplier for these components, but it will come at a 30% premium.
4. Logistics – Even if the parts and subassemblies can be produced on time, storage and transportation are two constraints that fall under logistics. Warehouse space is limited and expensive. Likewise, different modes of transportation also have capacity limits and time constraints.
5. Quality – No matter how streamlined an operation, yield loss due to units that come off the assembly line and fail to pass the quality assurance (QA) standards will drive up production costs and eat up inventory. Some models naturally have higher yield loss than others, and this must be accounted for in the S&OP plan. Due to the maintenance of Assembly Line A in the main facility, there is currently a 5- unit deficit for Gamma Ultra units. The supply team discovers that Test Facility 1 can manufacture these units, but because it has older equipment that is not properly calibrated, high yield losses are expected.
The supply team runs through the constraints and discovers the limitations highlighted in blue above. They come up with several options, highlighted in blue above highlighted in green text, to work around these constraints. Given that each mitigation option has a cost, they come up with several supply scenarios.
Supply Scenarios:
1. Base Case – Accept shortages and backorder customers
2. Max Overtime – Run weekend shifts at 150% labor cost
3. Component Expedite – Pay a premium on Beta components
4. Retooling – Bring in the original manufacturers of the equipment in Facility 1 to perform calibration
5. Hybrid Approach – Targeted overtime + selective expediting + in-house calibration
Here is the Supply Plan that they generated for August, along with some suggested mitigation options.
August Supply Plan
| Product | Demand | Base Capacity | Gap | Inventory Impact | Selected Mitigation Options |
| Alpha Pro | 115 | 110 | -5 | Draw down by 5 | Expedite |
| Beta Elite | 145 | 130 | -15 | Critical shortage | Overtime |
| Gamma Ultra | 90 | 85 | -5 | Critical shortage | Line rebalancing + calibration |
| Total | 350 | 325 | -25 | Net shortage | Multiple actions |
Phase 4: Financial review
Finance is responsible for telling the story of how the supply plan scenarios, generated in the previous phase, will impact the financial performance of the organization.
The financial director calls a meeting with his team, consisting of financial analysts, inventory managers, financial analysts, and business controllers. The financial review meeting begins with a review of the preliminary financial plan for the upcoming month.
Next, the team runs through the financial impact of each of the supply plan scenarios. The financial analysts model revenue and cost. The inventory managers focus on available working capital. The cost accountants break down the revenue and cost figures for each product or SKU. The business controllers pull together the big picture view, helping everyone to understand the overall financial impact.
Financial Impact of Supply Plan Scenarios
1. Base Case – Accept shortages and backorder customers
2. Max Overtime – Run weekend shifts at 150% labor cost
3. Component Expedite – Pay premium on Beta components
4. Retooling – Bring in the original manufacturers of the equipment in Facility 1 to perform calibration
5. Hybrid Approach – Targeted overtime + selective expediting + in-house calibration
Phase 5: Executive Review
Now that the financial impacts of each scenario have been quantified, an executive decision is needed. The CEO or General Manager calls together the heads of sales, operations, and finance … the same individuals who led the meetings at each prior phase. They go over the tradeoffs inherent in each supply scenario. It becomes obvious that doing nothing, the base scenario, is very costly to the bottom-line revenue. The executive team ultimately decides to put in several concurrent mitigation solutions, going with the hybrid approach scenario, and the CEO signs off on the decision.
This final approved plan is established for the upcoming month and serves as the baseline plan for the next planning cycle.
Final Approved August Plan
| Product | Demand | Approved Production | Production Backlog | Sales Forecast | Ending Inventory |
| Alpha Pro | 115 | 110 | 5 | 115 | 33 |
| Beta Elite | 145 | 140 | 5 | 145 | 37 |
| Gamma Ultra | 90 | 90 | 0 | 90 | 15 |
| Total | 350 | 340 | 10 | 350 | 85 |